# Client Details

## Client Details Page Overview

When clicking the Link next to a [client record](https://documentation.2pintsoftware.com/stifler/2.10/operations/dashboard/overview-and-navigation/devices/clients/..#extended-search) in the Dashboard, the Client Details page loads. The Client Details page displays information about a specific client in four sections.&#x20;

<figure><img src="https://109907496-files.gitbook.io/~/files/v0/b/gitbook-x-prod.appspot.com/o/spaces%2FYUaU4nvWOjjzrdVpKtdy%2Fuploads%2F1mOGI5hmIJ7t8TfrOL88%2FStifleRDashboard-2.10-ClientDetails.jpg?alt=media&#x26;token=932d3c6b-169a-43f1-8ac6-7df97a31a013" alt=""><figcaption></figcaption></figure>

In the **Database Information** section, real-time information about a client is displayed. This includes Domain, Computer Name, StifleR Client Agent ID, connection timestamps, as well as client version, etc.&#x20;

<figure><img src="https://109907496-files.gitbook.io/~/files/v0/b/gitbook-x-prod.appspot.com/o/spaces%2FYUaU4nvWOjjzrdVpKtdy%2Fuploads%2FFUXbVvgR8kfrGBgEcuhV%2FStifleRDashboard-2.10-ClientDetails-DBInformation.jpg?alt=media&#x26;token=b7bae3fa-7474-40be-be71-d74f0652d19c" alt=""><figcaption></figcaption></figure>

On the top right, a table is displayed which includes buttons revealing different information:&#x20;

Logon sessions, Administrators, Network information, BC (BranchCache) Statistics, DO (Delivery Optimization) Statistics, and Application data. Select each button to review the data.&#x20;

<figure><img src="https://109907496-files.gitbook.io/~/files/v0/b/gitbook-x-prod.appspot.com/o/spaces%2FYUaU4nvWOjjzrdVpKtdy%2Fuploads%2F4M1anYmkXwaGc7OkeV06%2FStifleRDashboard-2.10-ClientDetails-TopRight.jpg?alt=media&#x26;token=49c635a7-08f3-4fc5-8318-c3fdad9384c9" alt=""><figcaption></figcaption></figure>

On the bottom right, further information is displayed which includes buttons revealing:

Connectivity History, Network Measurement, and Disk & Cache Information. Select each button to review the data.

<figure><img src="https://109907496-files.gitbook.io/~/files/v0/b/gitbook-x-prod.appspot.com/o/spaces%2FYUaU4nvWOjjzrdVpKtdy%2Fuploads%2FKpLVzaomUrfeCcBrpVLz%2FStifleRDashboard-2.10-ClientDetails-BotRight.jpg?alt=media&#x26;token=d3ea78d8-5517-4710-a9de-6cb2567062f5" alt=""><figcaption></figcaption></figure>

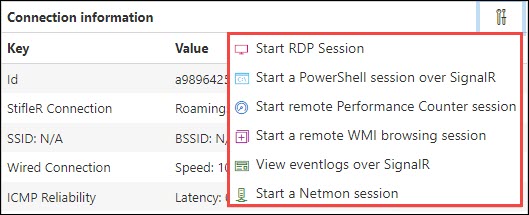
At the bottom right of the screen, in the **Connection information** section, additional network information is displayed which includes IP information, connection type, uptime, etc.&#x20;

<figure><img src="https://109907496-files.gitbook.io/~/files/v0/b/gitbook-x-prod.appspot.com/o/spaces%2FYUaU4nvWOjjzrdVpKtdy%2Fuploads%2FjpoFBAEaeyGu0LPdiexE%2FStifleRDashboard-2.10-ClientDetails-ConnectionInfo.jpg?alt=media&#x26;token=a824692b-9d38-47b5-95ca-015f5e132e83" alt=""><figcaption></figcaption></figure>

## Remote Tools Functionality

At the top right of the **Connection information** section, there is a small tool icon, which if clicked, opens a drop down menu which displays the following actions:

<figure><img src="https://109907496-files.gitbook.io/~/files/v0/b/gitbook-x-prod.appspot.com/o/spaces%2FYUaU4nvWOjjzrdVpKtdy%2Fuploads%2FiI01jolQvj8lfpaIy6av%2FStifleRDashboard-2.10-ClientDetails-ConnectionInfo-DropDown.jpg?alt=media&#x26;token=5bbc6791-70b1-4c9b-91cf-d6cb4a6bf7fc" alt=""><figcaption></figcaption></figure>

Please see the [Client Management & Remote Tools](https://documentation.2pintsoftware.com/stifler/2.10/operations/client-management-and-remote-tools) section of the documentation for more information about Remote Tools functionality.
