> For the complete documentation index, see [llms.txt](https://documentation.2pintsoftware.com/llms.txt). Markdown versions of documentation pages are available by appending `.md` to page URLs; this page is available as [Markdown](https://documentation.2pintsoftware.com/deployr/monitoring-and-reporting/monitoring-task-sequences-in-the-dashboard.md).
# Monitoring task sequences in the dashboard
## Requirements
DeployR relies on the 2Pint StifleR Server & Client to provide the task sequence monitoring function, similar to how it monitors a ConfigMgr task sequence. The StifleR server is already configured with the basic settings required for monitoring. However, you must also configure DeployR to include the StifleR Client. Required 2Pint Software for DeployR Monitoring & Remote Tools:
* DeployR Server
* StifleR Server
* StifleR Action Hub integrated into StifleR Server
* StifleR Client configured for StifleR Server
### Application Content Item
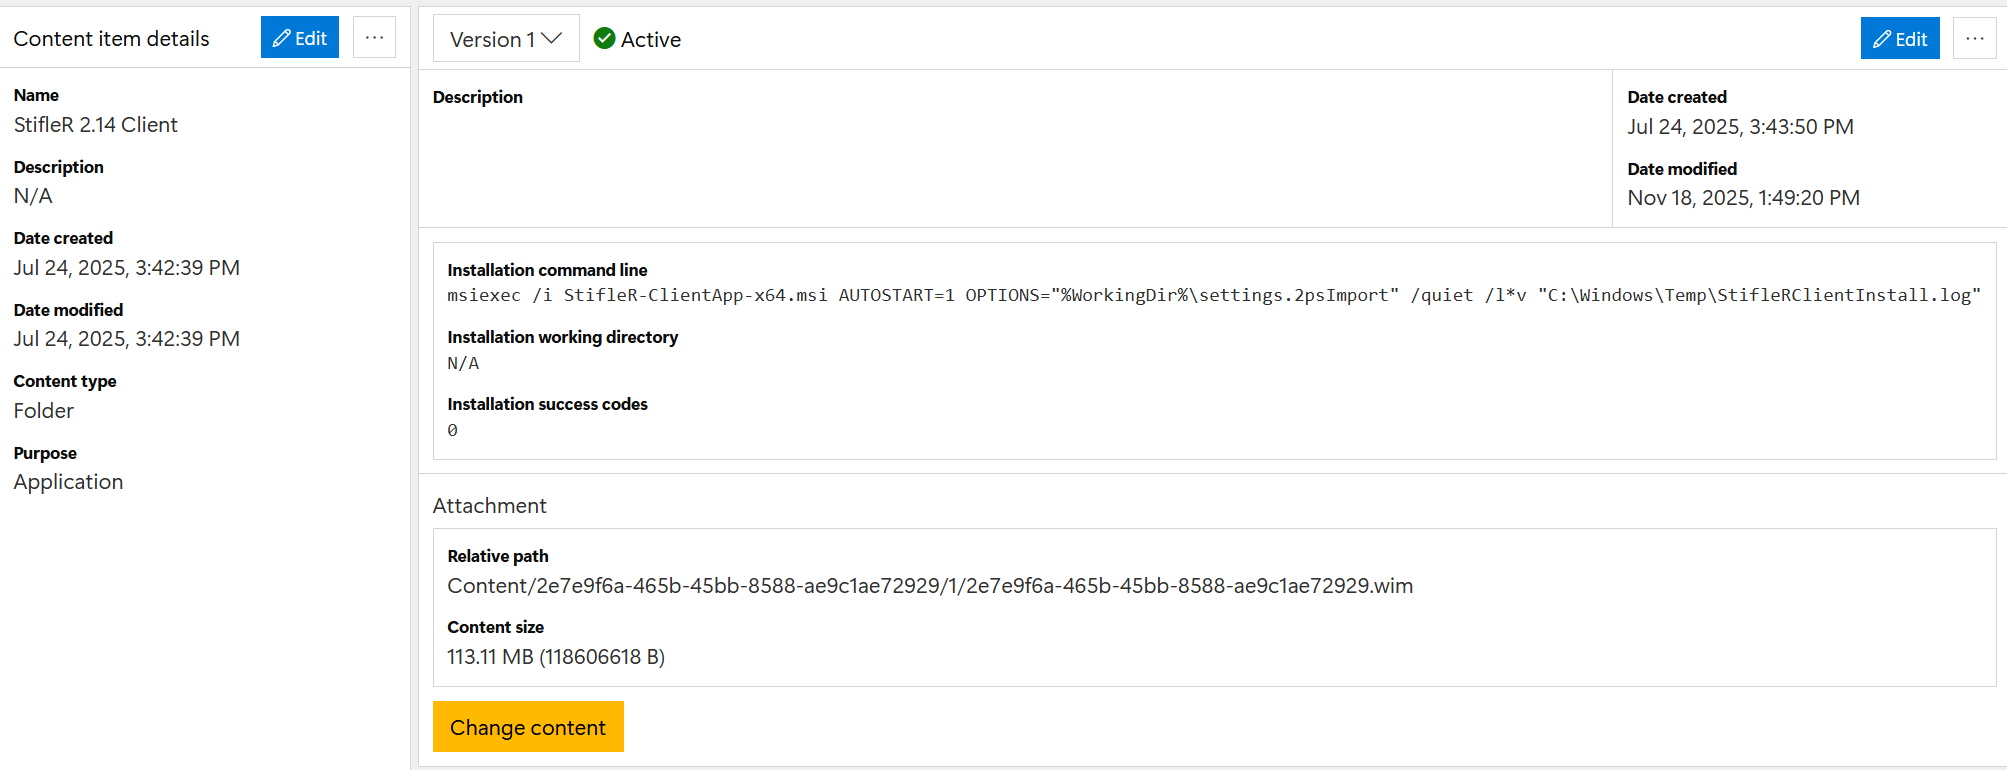
The StifleR Client needs to be added to DeployR as an Application Content Item, sample command line:
```
msiexec /i StifleR-ClientApp-x64.msi AUTOSTART=1 OPTIONS="%WorkingDir%\settings.2psImport" /quiet /l*v "C:\Windows\Temp\StifleRClientInstall.log"
```
The content item should contain the MSI installer and the `.2psImport` file. For more details, see the [StifleR Client Installation ](https://documentation.2pintsoftware.com/stifler/setup/installation/stifler-client-installation)docs
{% hint style="info" %}
NOTE: When creating your settings.2psImport file, if you are not a StifleR customer using StifleR in your environment and only using the StifleR client for DeployR monitoring, make sure you configure these settings in your Client config using the Config Editor before exporting:\
\
"Client Report Only Mode" set to Enable\
"BITS and Delivery Optimization allowed bandwidth" set to 1024000\
"DefaultDisconnectedBITSPolicy" set to 1024000\
"DefaultDisconnectedDOPolicy" set to 1024000\
\
If you are a StifleR customer, do not use these values; adjust these settings to suit your environment instead.
{% endhint %}
### WinPE Stage Monitoring
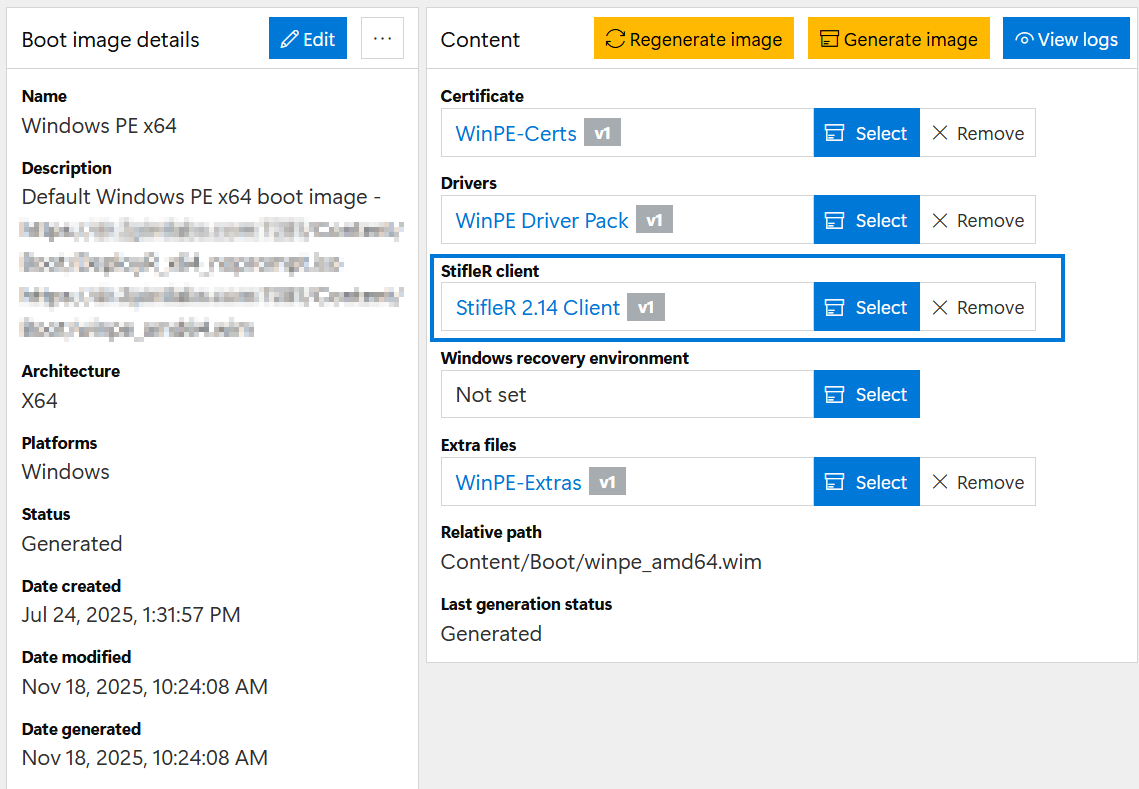
To enable monitoring of the task sequence from start to end, including the WinPE stage, the StifleR client is required to be integrated into DeployR. This process is done for you automatically when you create a content item for the StifleR agent and add it into the Boot Media page. For additional details, see the [Generate Windows PE Boot Images](/deployr/deployment-methods/generate-windows-pe-boot-images.md) page.
### Full OS Stage Monitoring
#### Non-Persistent Monitoring (StifleR Client removed after OSD)
If the StifleR Client has been integrated into the WinPE boot image, DeployR automatically migrates the client from WinPE into the full OS so that the task sequence can still be monitored. DeployR also automatically cleans up the StifleR Client at the end of the task sequence.
#### Persistent Monitoring (StifleR Client Persists after OSD)
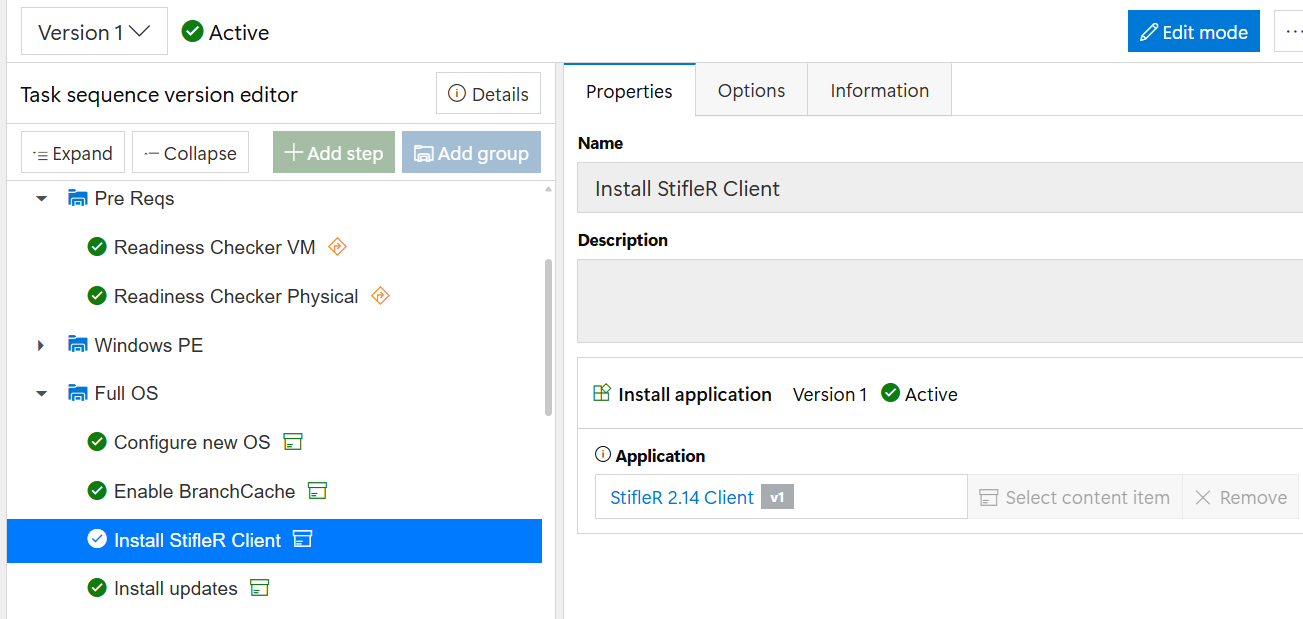
In many cases, your organization will also be leveraging StifleR for all of these benefits and will want the StifleR Agent to continue on after OSD is completed. To ensure this happens, use the Application Content Item and install it during the Task Sequence once in the full OS, using an **Install application** step.
### Dashboard Monitoring of the task sequence
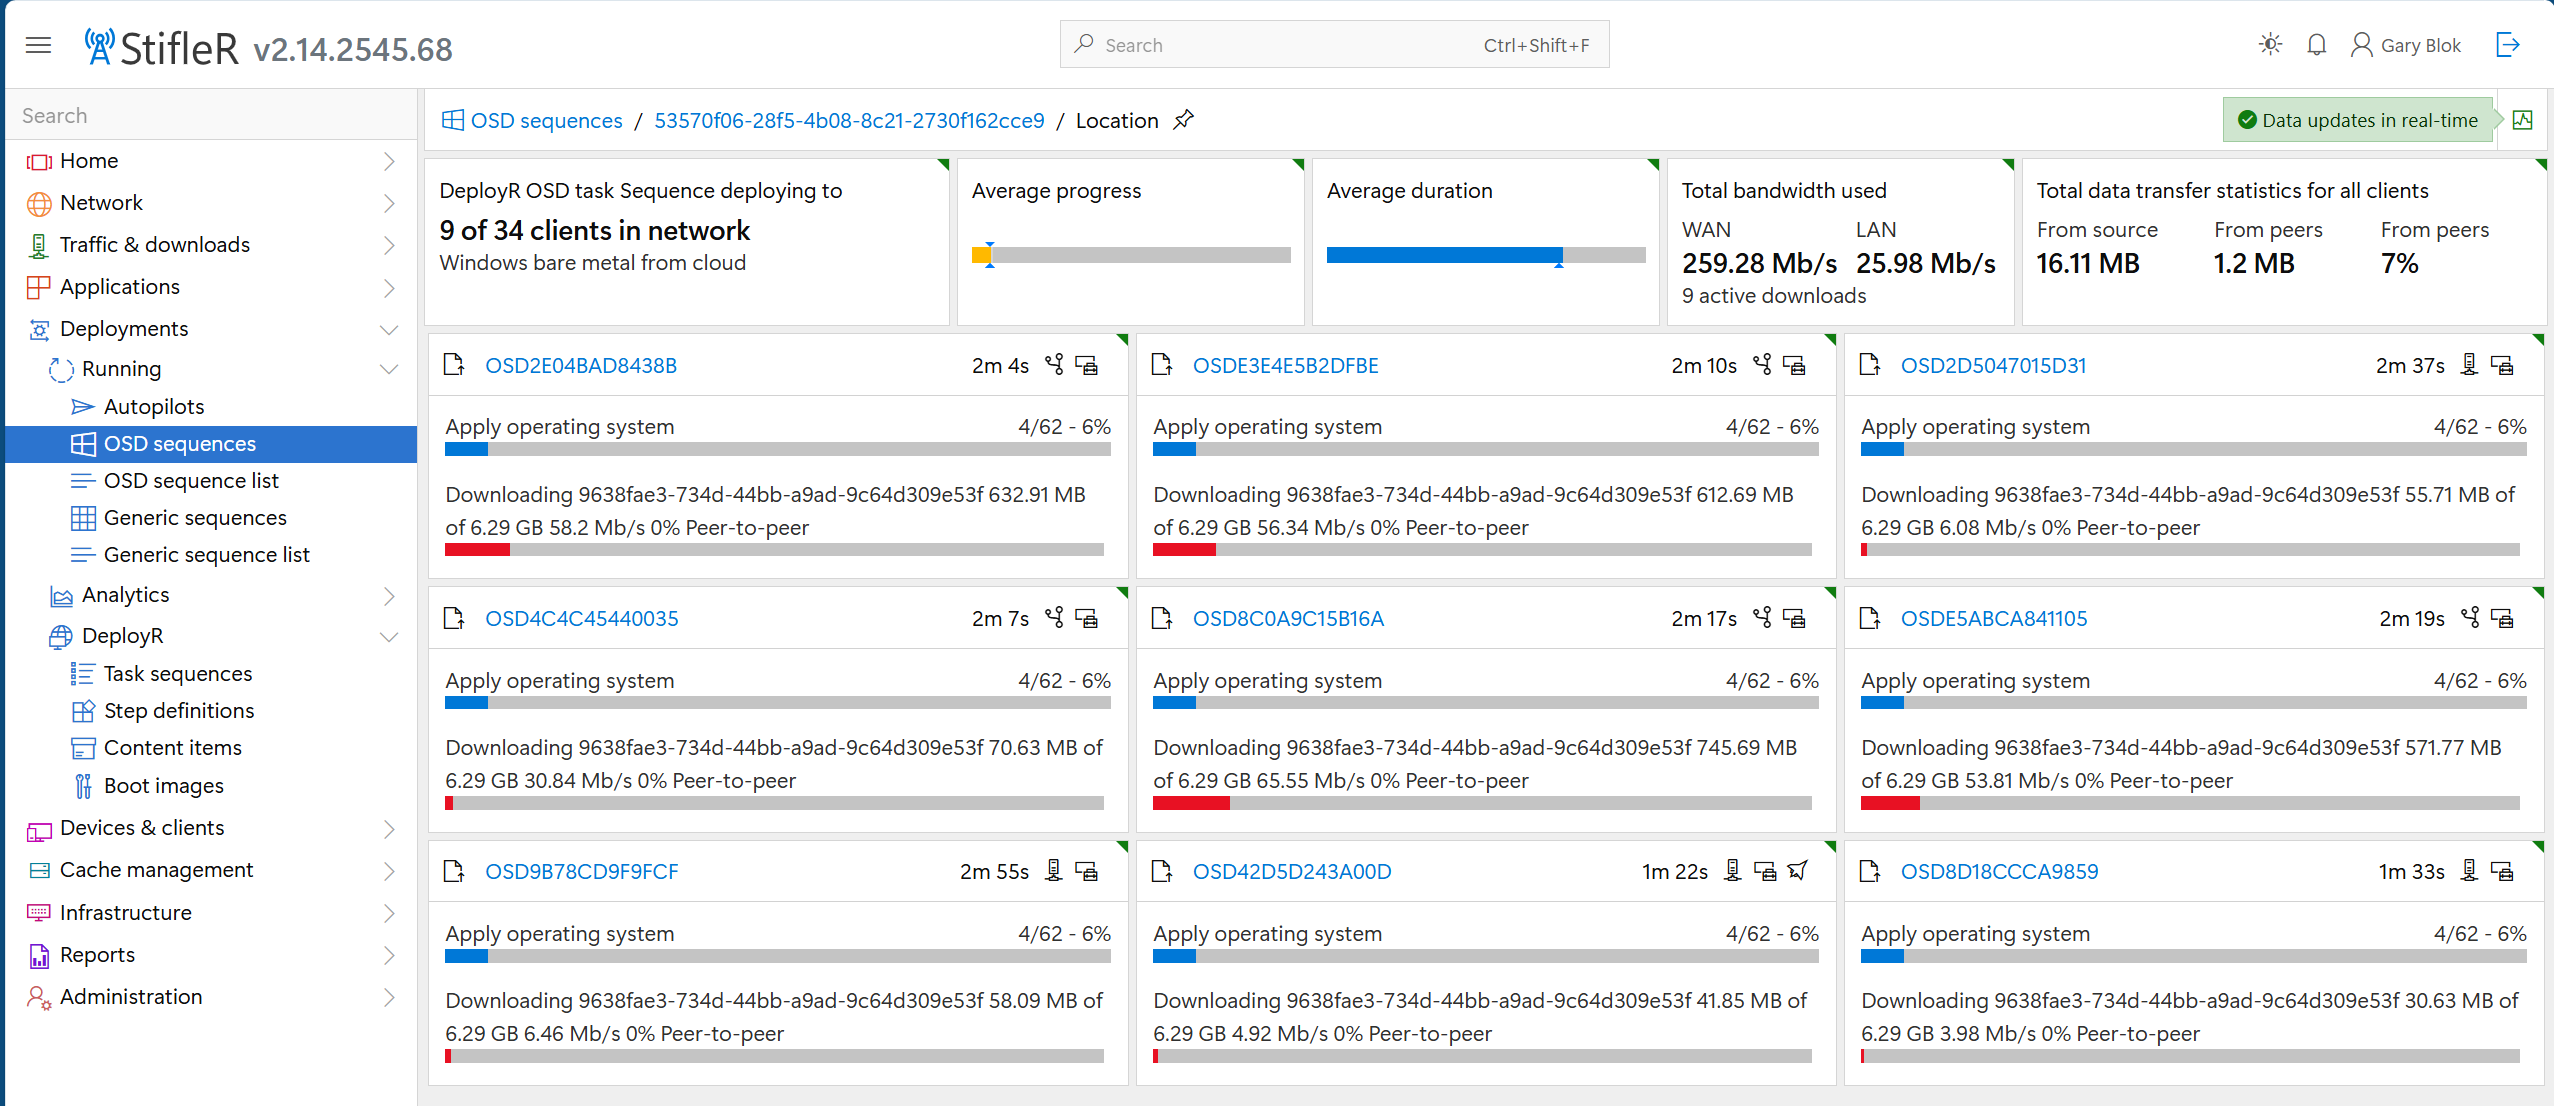
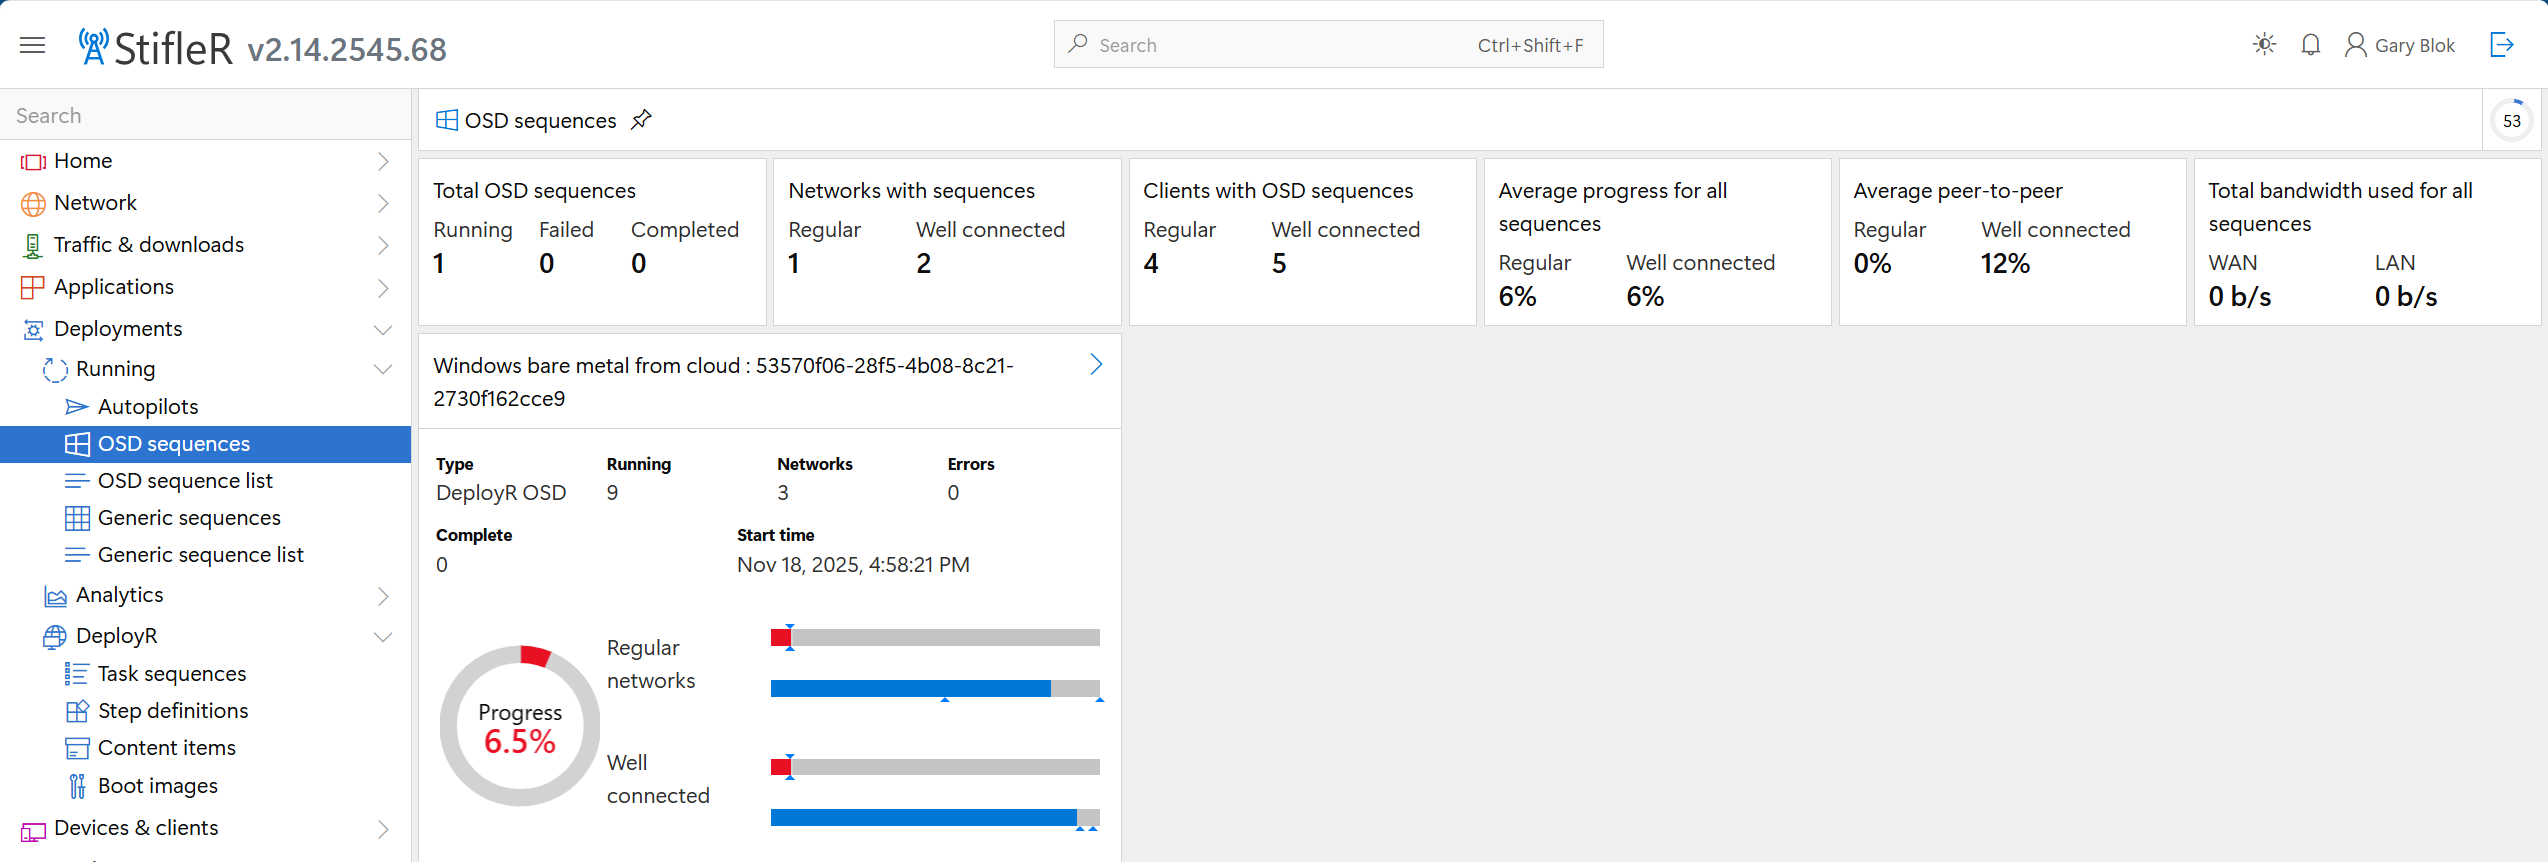
Now that the StifleR client is integrated into your process, the client will relay data to the StifleR server and data will start to populate into the dashboard. Deployments -> Running -> OSD sequences.
The first screen is an overview of all the OSD task sequences currently running. Here, the task sequence "Windows bare metal from cloud" currently running on 9 machines across 3 different networks.
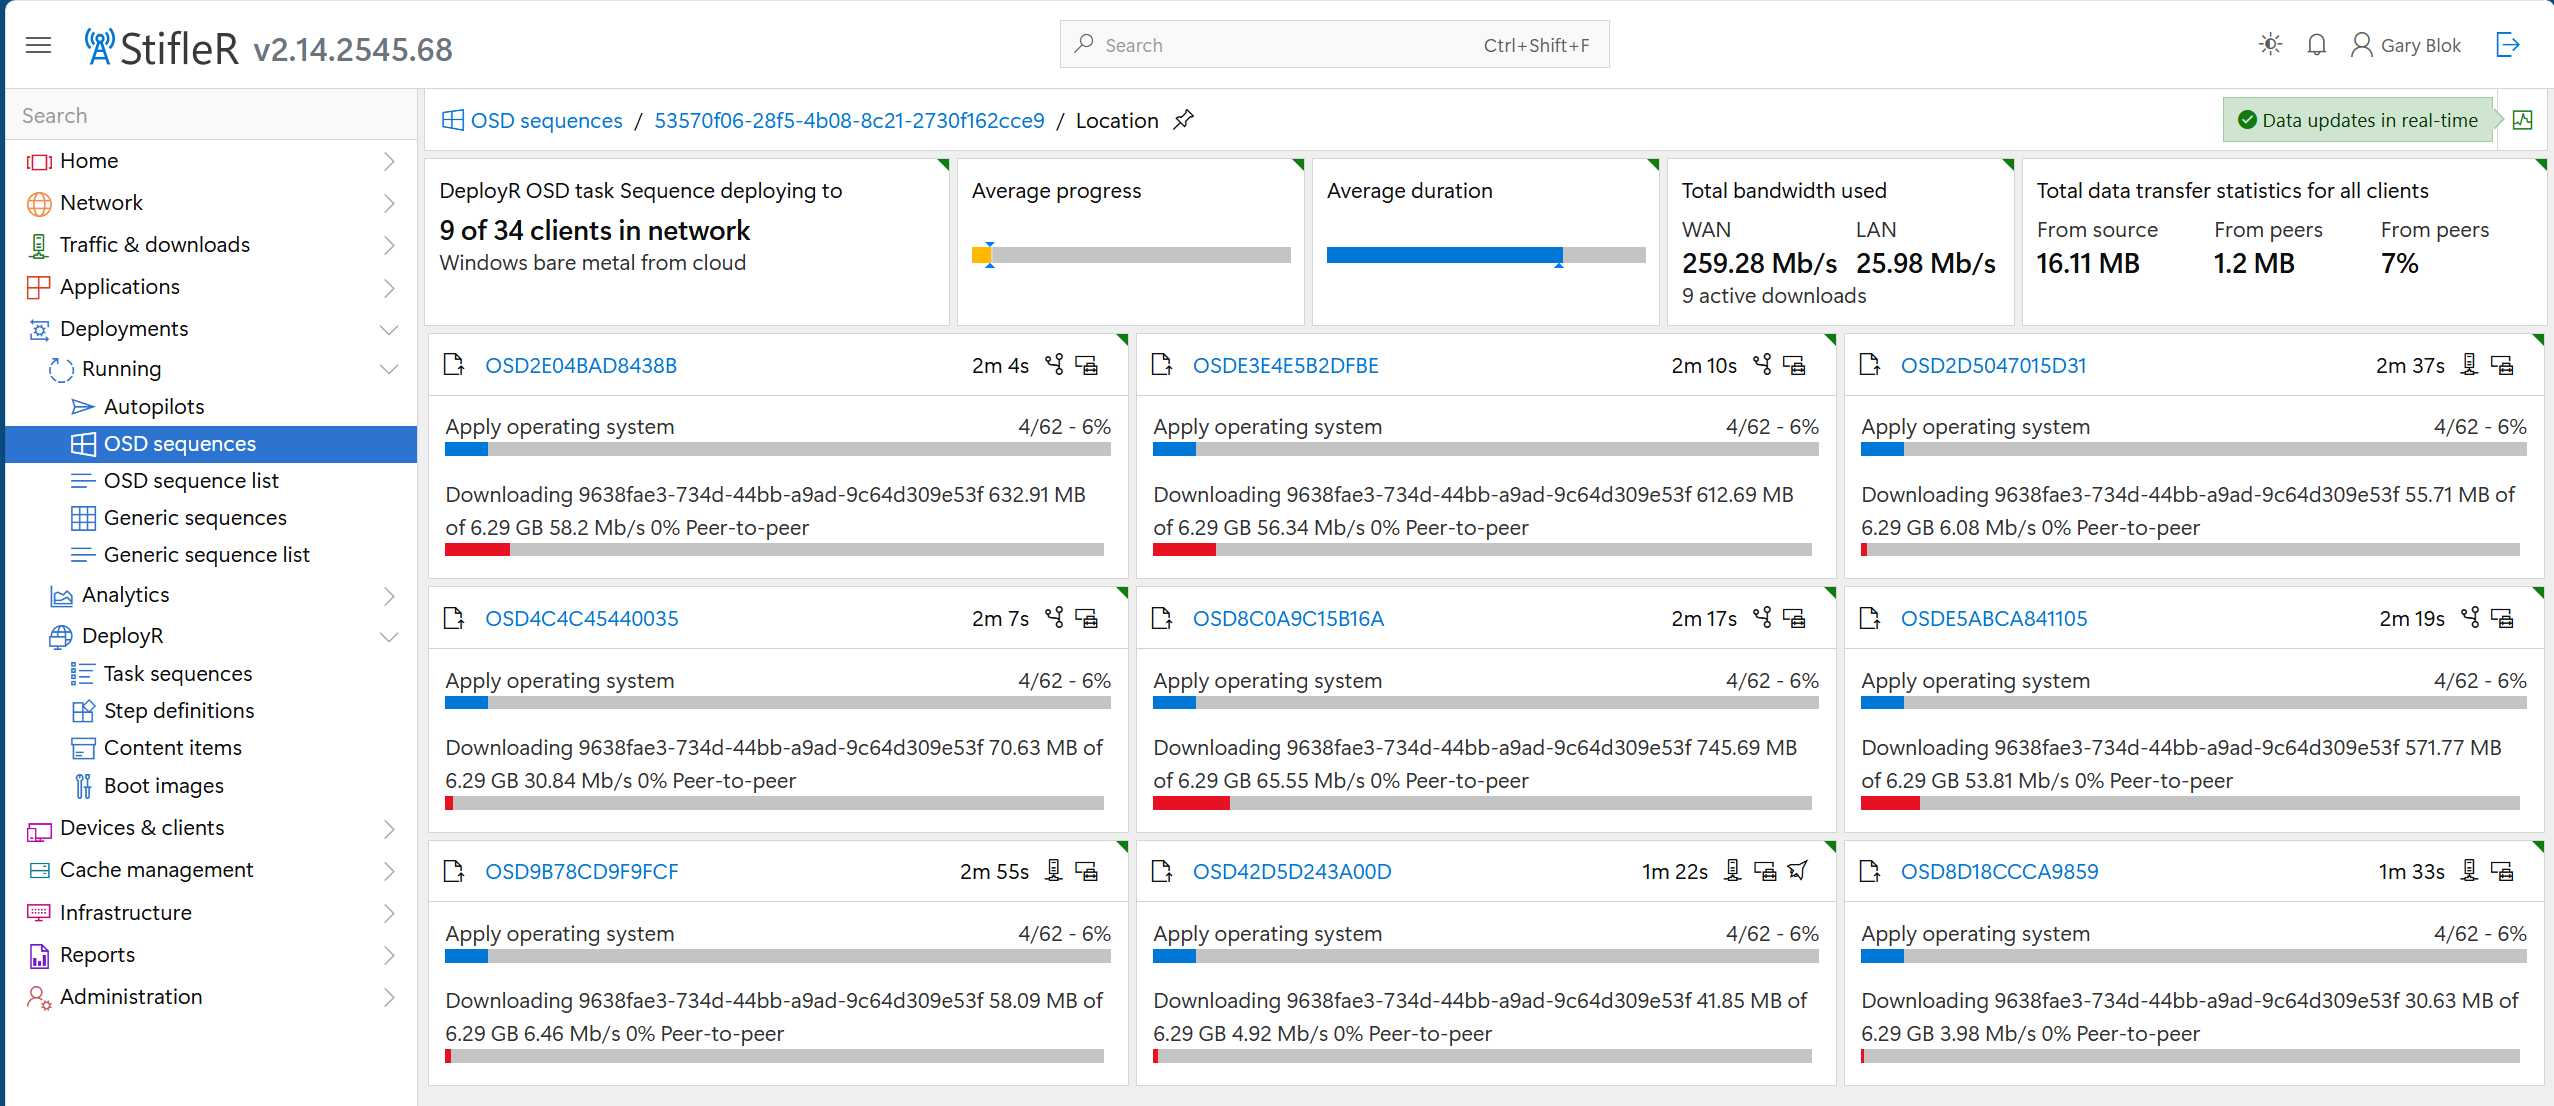
When you click the little blue arrow next to the Name | GUID of the task sequence, you get details about each device.
Each device will display the name of the computer. When it is in WinPE, its name will be OSD, then the first 12 characters of the UUID of the device. There will be different icons in the title bar.
Hovering over the icons will tell you their meaning. The status bars will provide information about the current download and the overall process of OSD. By clicking on the name of a device, it will drill into specific details about that device.
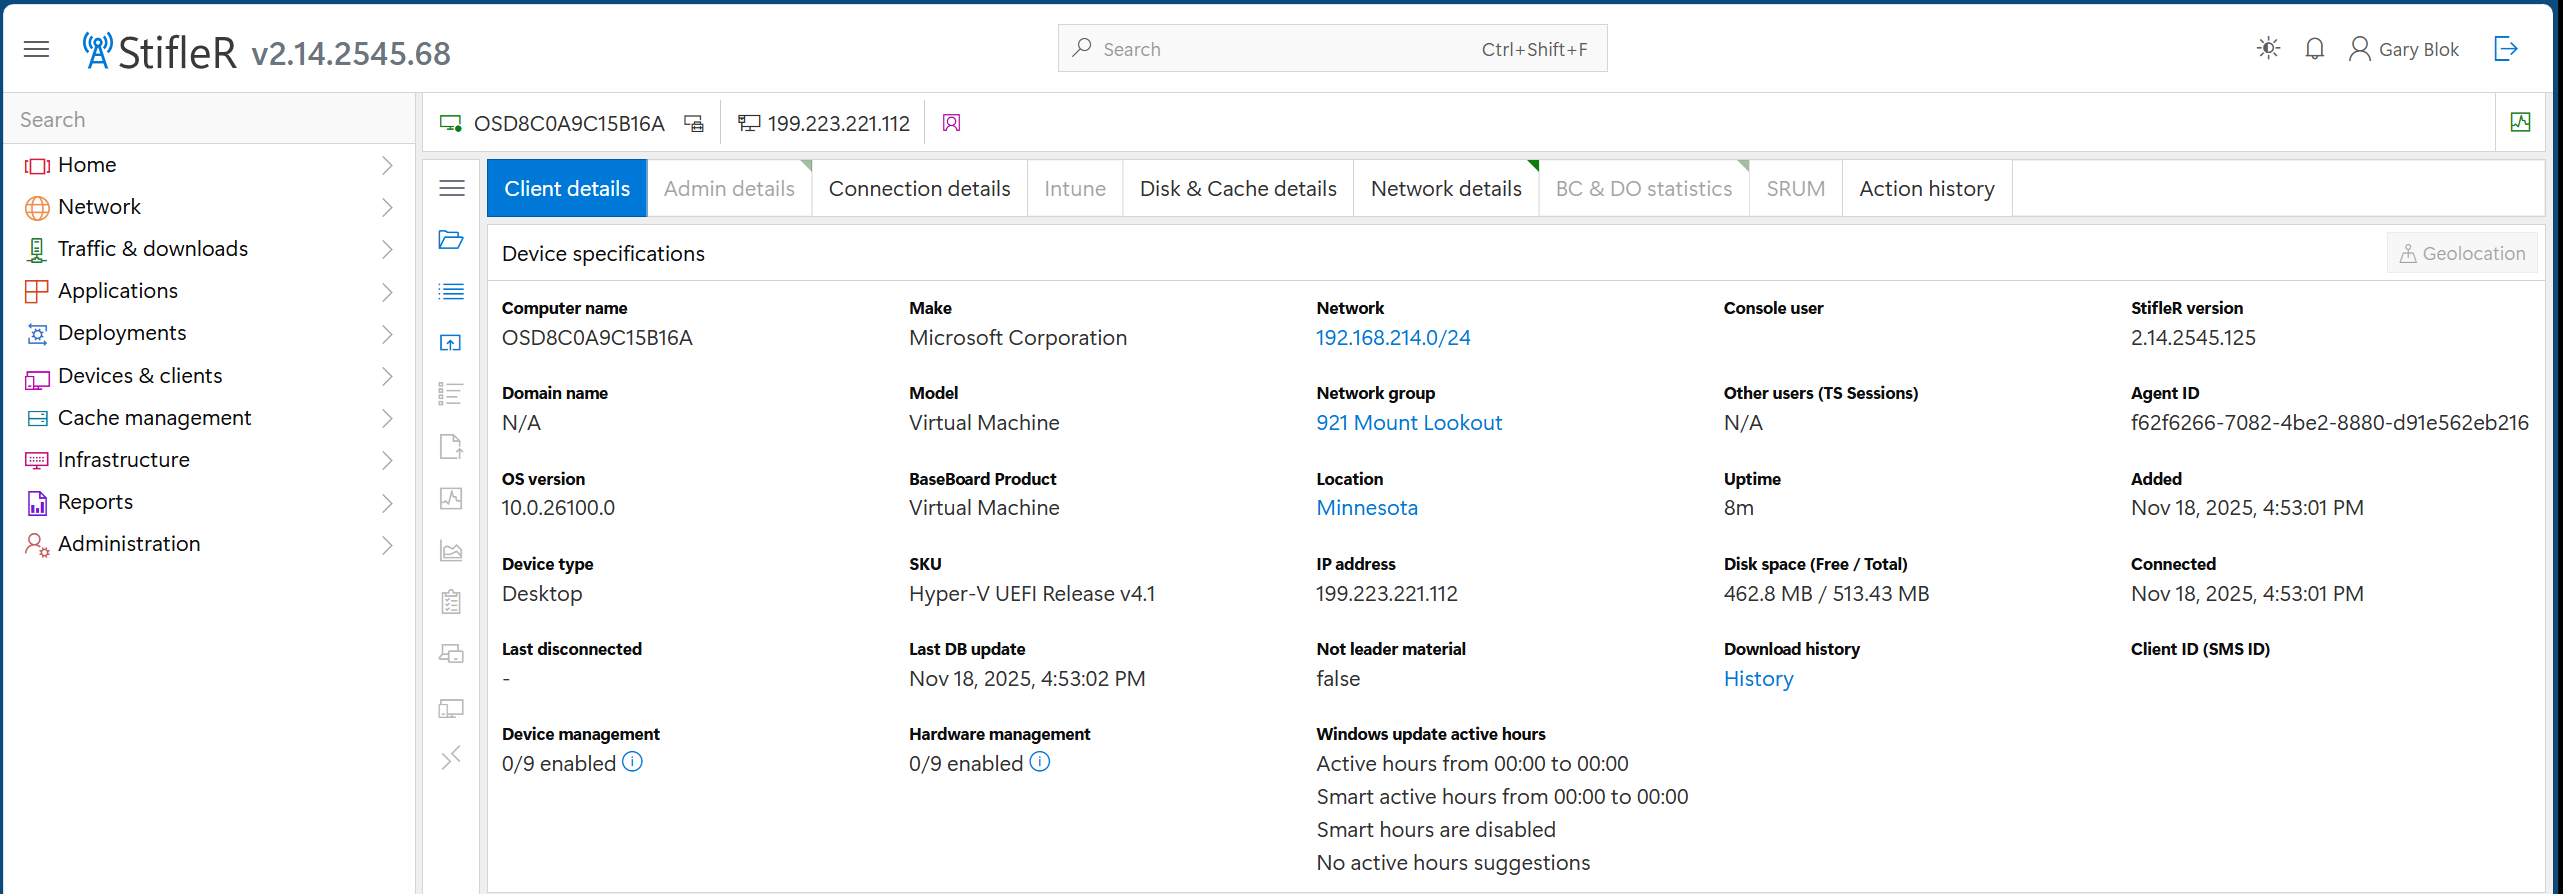
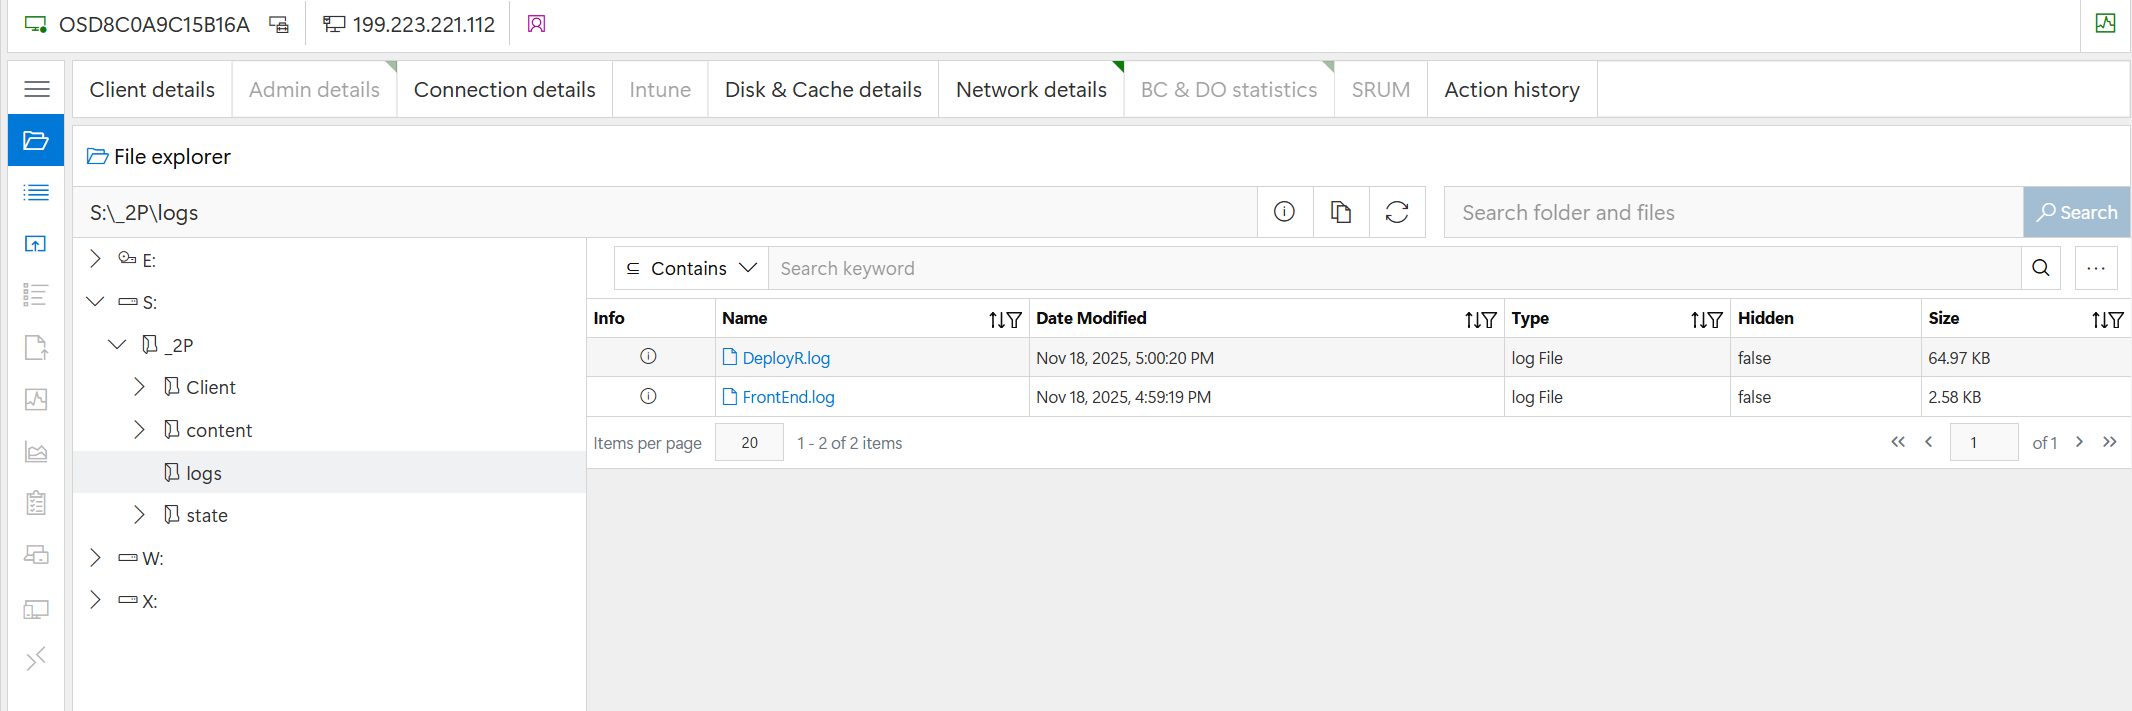
The Client details tab shows information about the device's network and hardware. To the left of the device are the remote tools (if configured in the environment) that can be used while in WinPE or the full OS. This device is currently in WinPE, so only a few tools are available, including Folder Explorer, Registry Explorer, and WMI Explorer. Here is an example of browsing the file system; logs can be opened directly from the endpoint.
There are more things that can be done, so poke around, and happy monitoring.
---
# Agent Instructions
This documentation is published with GitBook. GitBook is the documentation platform designed so that both humans and AI agents can read, navigate, and reason over technical content effectively. Learn more at gitbook.com.
## Querying This Documentation
If you need additional information that is not directly available in this page, you can query the documentation by asking a question.
Perform an HTTP GET request on the following URL with the `ask` and `goal` query parameters:
```
GET https://documentation.2pintsoftware.com/deployr/monitoring-and-reporting/monitoring-task-sequences-in-the-dashboard.md?ask=&goal=
```
`ask` is the immediate question: it should be specific, self-contained, and written in natural language.
`goal` is what the user is ultimately trying to achieve, the reason they need the answer. Sharing it helps GitBook give you a better, more relevant answer. A goal is most helpful when it describes the outcome the user wants rather than restating the question. For example, with `ask=how do I create an API token`, a goal like `automate deployments from our CI pipeline` lets GitBook tailor the answer to that use case.
The response will contain a direct answer to the question and relevant excerpts and sources from the documentation.
Use this mechanism when the answer is not explicitly present in the current page, you need clarification or additional context, or you want to retrieve related documentation sections.